Logging
Enabling more verbose logging can be helpful when debugging issues. Logging is controlled by the logger component.
See the logger configuration for more information.
System Logs
The System Logs page lets you read Viserons log file from the web interface, without needing shell access to the container.
It can be accessed by admins from the Settings > Logs page.
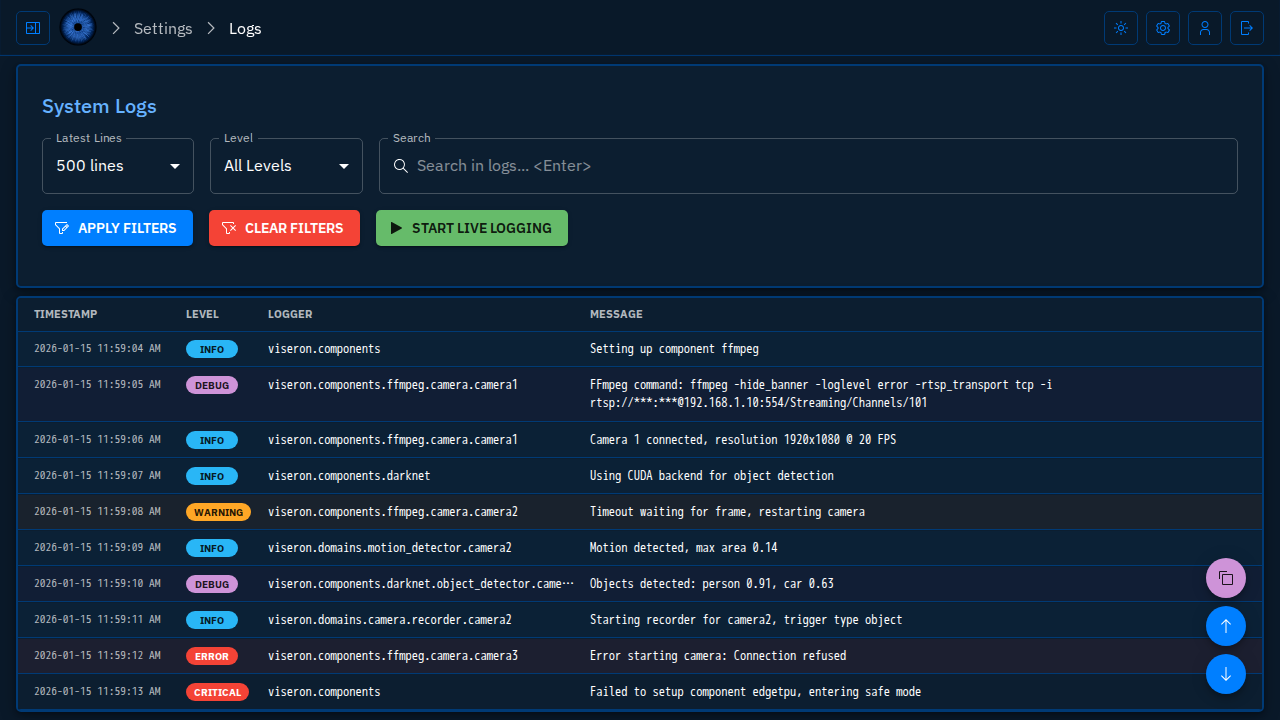
The page reads the viseron.log file found in your config directory, which contains the same output as docker logs viseron.
Each line is split into its timestamp, level, logger name and message, and is color coded by severity.
Timestamps are shown in the timezone set in your profile, which defaults to the timezone of your browser.
Lines that do not match Viserons log format, such as stack traces, are displayed as they appear in the file.
Only the current viseron.log is read. If you have enabled log rotation with VISERON_LOG_MAX_BYTES, the rotated files (viseron.log.1 and so on) are not available in the frontend.
Filtering
| Control | Description |
|---|---|
Latest Lines | How many log lines to fetch, between 100 and 5000. The most recent lines are always returned. |
Level | Show a single log level only. |
Search | Case insensitive free text match against the whole log line. |
Filters are applied by clicking APPLY FILTERS, or by pressing Enter while typing in the search field.
CLEAR FILTERS resets both the level and the search filter.
The Level filter matches one level exactly, it does not include the more severe levels.
Selecting Error will therefore not show Critical entries.
Lines that could not be parsed have no level, and are hidden while a level filter is active.